Bases: object
Class to read out gemma output.bin
Reads in header information and further acts as an iterator object. Data from samples are not read by default.
Samples can be accessed as gemma[samplename] or gemma[sampleindex]
| Parameters : | fname : str, filename of binary gemma output file, default gemma_output.bin version : version of gemma executable, default 34 persistent : keep samples in memory if True (default), otherwise re-read from file |
|---|
Attributes
| fname | str | filename |
| nsamples | int | number of samples |
| niterations | int | number of iterations |
| diag | bool | g-emma diagnostics mode |
| useLLS | bool | linear least squares approximation used in g-emma |
| withintriangle | bool | behaviourals constrained within individual trapezoids/triangles |
| stopmax | bool | stopped iterations when maximum behaviourals were reached (and nbehave is therefore an approximation) |
| nendmembers | int | number of end-members |
| endmembers | list of strings | end-member names |
| nsolutes | int | number of solutes |
| solutes | list of strings | solute names |
| samples | dict | sample objects, with samplenames as keys |
| samplenames | list | sample names |
| persistent | bool | keep samples in memory |
| version | int | version of G-EMMA executable |
Methods
Calculate end-member contributions for all samples, constructs DataFrame
| Returns : | emc : pandas.DataFrame with end-member contributions |
|---|
Create DataFrame with percentiles of parameters for all samples. For subsequent use sets self.pctresult with the result. Uses self.pctresult if requested parameters / percentiles are in self.pctresult
| Parameters : | percentiles : list-like of integers. Percentiles in the 0-100 range are reset to the 0-1 range. params : list of parameters to calculate percentiles of. mask : tuple with first item parameter name and second item equality |
|---|---|
| Returns : | pctresult : pandas.DataFrame |
Calculate weighted percentiles of A, given weights in W
| Parameters : | A : MxN (masked) array of values to determine percentiles on pct : list of P percentiles to be determined W : Mx1 array of weigths method : what to return if there is no exact percentile?
|
|---|---|
| Returns : | P : PxN array of calculated percentiles |
Bases: object
Class that contains one g-emma sample run
Reads in sample header information and further acts as an iterator object along datarows. Data from samples are not read by default.
Data can be accessed as sample[column]
| Parameters : | gemma : gemma-object read_data : bool. Read data (default False) |
|---|
Attributes
| gemma | gemma object | parent gemma object |
| endmembers | list of strings | end-member names |
| name | string | name of sample (sample code) |
| date | datetime | date/time information of sample |
| nbehave | int | number of behavioural samples |
| data | pandas.DataFrame | sample data |
Methods
Create boxplot or violin plot
| Parameters : | params : list of parameters from data to draw violin : bool, draw violin plot around boxplot if True (default) |
|---|
Examples
(Source code, png, hires.png, pdf)

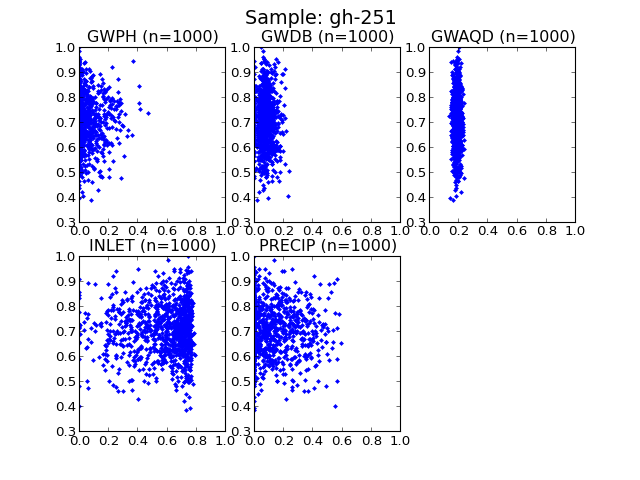
Function to draw dotty plot of given parameters
| Parameters : | params : list of parameters from data to draw |
|---|
Examples
(Source code, png, hires.png, pdf)

Function returns Series with frequencies of occurrence in the behavioural runs for each separate endmember and all possible end-member combinations
Return DataFrame with values of params @ percentiles, weighed by likelihood (LH) column
| Parameters : | pct : list of percentiles params : list of parameters to calculate (default: all) mask : boolean Series or ndarray to select data |
|---|---|
| Returns : | p : DataFrame PxN array of calculated percentiles |
Plotting functions for emma glue results
Create color dictionary for use in params_time for a black/white plot
| Parameters : | params : list of parameters to color |
|---|---|
| Returns : | col : dict of params -> colors (in this case black) |
Create color dictionary for use in params_time for a color plot Solutes part of end-members receive color of end-member
| Parameters : | params : list of parameters to color dcol : dict of end-member or solute names to colors |
|---|---|
| Returns : | col : dict of params -> colors |
Create label dictionary for use in params_time Solutes part of end-members receive label of end-member - solute
| Parameters : | params : list of parameters to label dlabel : dict of parameters -> labels |
|---|---|
| Returns : | col : dict of params -> colors |
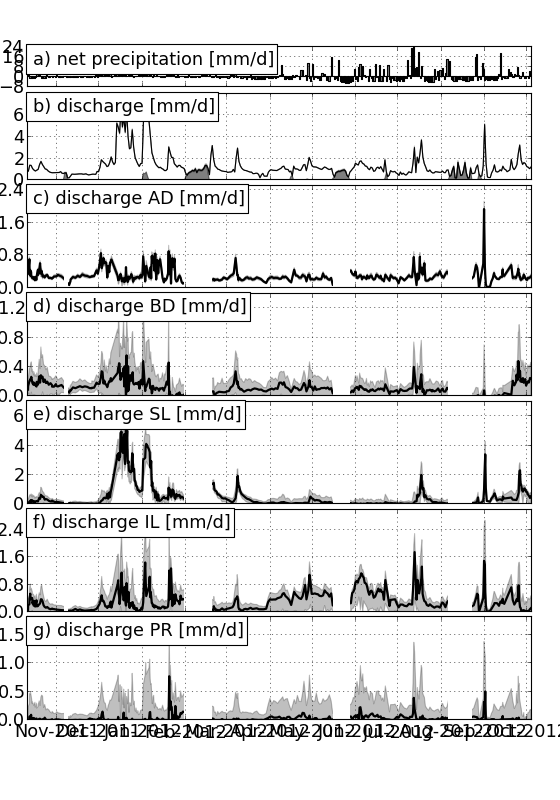
Convenience function for plotting endmembers over time, including uncertainty. Params and param dicts are set to end-members,
labelstr and unitstr are also set.
| Parameters : | fracload : plot either fractions plot or load plot (default ‘frac’) others : see params_time |
|---|
Examples
(Source code, png, hires.png, pdf)

Workhorse function for plotting a lineplot of parameter values over time, including uncertainty
| Parameters : | params : list of parameters to plot pct : list of three or more percentiles: lower bound, median value, upper bound. If more than three are given, additional uncertainty bands are drawn result : g-emma result, either filename or gemma object separate : bool, plot separate plots for each param (default True) stacked : bool, stack plots, eg when contributions are additional (default: False) calcload : bool, calculate loads for solutes (default False) hiatuses : list of lists of two datetime objects. Periods are excluded from the resulting plot plot_peq : bool, plot precip, evap and discharge data (default True). Assumes a module+function plot_data.create_petq(afig=fig, box=box.next()) fname : filename to write plot to. If None (default), output to screen xlim : list of limits in x (default None) ylim : list of limits in y (default None) col : dictionary of colors for each param labels : dictionary of labels for each param, labelstr : string, additional part of label, denoting figure content (default ‘fraction’) unitstr : string, additional part of label, denoting unit of data (default ‘-‘) f_conv : float, conversion factor for load calculation (default 1.) returnfig : bool, return figure object and list of axes figsize : size of figure |
|---|
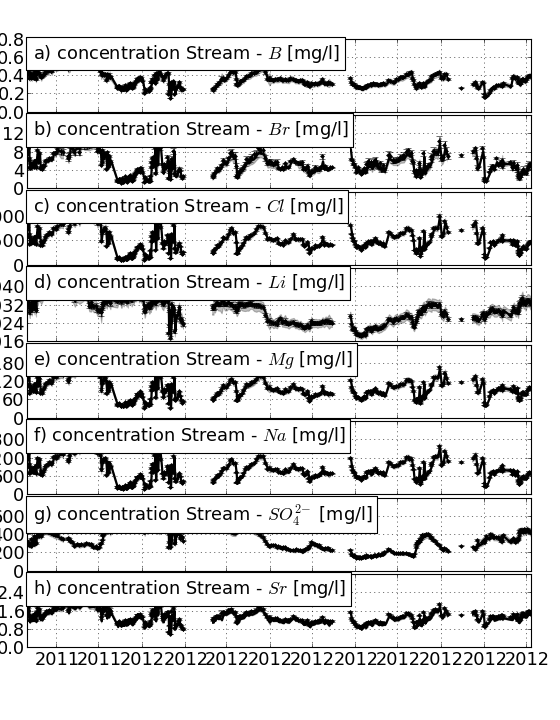
Function to plot calculated concentrations against measured concentrations
| Parameters : | fname_stream : filename of g-emma stream input file pct : list-like of percentiles (default: 0,50,100) result : g-emma result, either filename or gemma object hiatuses : list of lists of two datetime objects. Draws vertical grey bands to exclude period from figure fname : filename to write plot to. If None (default), output to screen returnfig : bool, return figure object and list of axes figsize : size of figure kwargs : additional parameters to pass to params_time |
|---|
Examples
(Source code, png, hires.png, pdf)

Convenience function to plot all solutes of a given endmember. including uncertainty. Params and param dicts are set to end-members,
labelstr and unitstr are also set.
| Parameters : | em : end-member others : see params_time |
|---|
File readers for G-EMMA input files
Convert multi-index dataframe of endmembers - solute to dataframes per end-member of solute characteristics
| Parameters : | df : pandas.DataFrame, usually result of read_gemma_endmembers |
|---|---|
| Returns : | mean : pandas.DataFrame of mean concentration end-members / solutes sd : pandas.DataFrame of standard deviation end-members / solutes min : pandas.DataFrame of minimum concentration end-members / solutes max : pandas.DataFrame of max concentration end-members / solutes |